A look back on the Washington Post database of people shot and killed by police
Now with ICE dominating the law enforcement news, sometimes I like to revisit issues of yesteryear. The Washington Post used to keep track of how many people police shoot and kill. It was and is a useful database. And then in 2025 they stopped counting. So it covers 2015 to 2024. And given recent cutbacks at the Washington Post, it’s safe to say it’s not going to be restarted.
But at least we have a solid (if limited) 10-year database of fatal police-involved shootings. It’s also useful because it’s very accessible and easy for even the statistically adept. The only active accurate database now is kept by Campaign Zero and their Mapping Police Violence (ideologically anti-policing and into police abolition, but still, kudos to them). And no, shamefully, the federal government still doesn’t keep track.
One interesting thing is how little the numbers changed year to year. Annual totals increased gradually every year (slightly exceeding population growth) from a low of 959 shot and killed in 2016 to a high of 1,175 in 2024. After ten years of #BLM, nothing changed. There were zero fewer blacks being shot and killed by police (and a lot lives lost with 2020’s related massive murder increase).
What we have in the 10 years of the Post database, is that cops in the USA shot and killed, on average) 1,043 people a year. Of those 1,043, 249 were black. And of those 1,043, 57 a year were “unarmed” (I put unarmed in quotes because it doesn’t mean the person wasn’t a lethal threat, just that the person wasn’t holding a weapon when shot and killed by police). Of those 56 “unarmed” people, 18 were black.
Worth flagging: Of the grand total, a full 20% (206 a year) of those shot and killed were flagged with obvious mental issues when they were shot and killed (however the WaPo defines “in crisis”).
Now 11 years ago I first commented that the real issue with police use of lethal force that nobody was talking about — and it wasn’t race — was disparity in different regions and individual police departments. Vast disparities. Back then Oklahoma stood out. So let’s stick with the Sooners. (Though one sees much the same in other similar states, all west of the Mississippi and with low black populations.)
Today I compared Oklahoma to the group of five New England states (New Hampshire, Vermont, Main, Rhode Island, and Massachusetts). Oklahoma has 4.1 million people and is 7.8% black. The New England states have 11.7 million people and are 7.6% black.
Even in raw numbers (charges with the rate are below), more people were shot and killed by police in Oklahoma than all of New England. And it’s not even close: 27 a year versus 17; more black people (4.6 versus 2); more unarmed people (2 versus 0.7). And more unarmed black people (0.4 versus 0). Yes, zero. In 10 years, police in New England shot and killed exactly 0 unarmed black men or women. One might say, at least in New England, #BLM was more of a moral panic than a crisis. (Or maybe it demonstrates the effectiveness of all those #BLM signs in all white communities. Who can say?) But that shouldn’t let the high-shooting states off the hook. (see charts, below.)
Looking at my city of New York City (23% black), in 10 years the NYPD shot and killed 85 people. (It should be noted that my more accurate tally from NYPD data comes out to 91, but let’s stick with WaPo numbers for consistency, even though they seem to miss 1 in 2016, 2018, 2020, and 2024, and 2 in 2021. My guess is the WaPo didn’t update for people who were shot by police and wounded, but died later.)
Of those 85 people shot and killed by the NYPD over 10 years 58 were black, 3 were unarmed (all 3 of whom were black), and 28% were flagged for “mental crisis.” (A higher percentage than the national average, but a percentage inflated, perhaps, due to the NYPD shooting far fewer people overall, just one-third the rate of the nation.)
Why these disparities may exist I won’t get into here. (The reasons are indeed multifaceted and complicated, though for starters I would point to gun laws, number of cops, different drugs, different political response, and different police training, different policy restrictions, and different police cultures regarding use of force.) But whatever the reasons, these disparities are real, they are consistent over time, and it seems like those who say they care could do much better addressing them honestly.
And now it’s my favorite time, quick and dirty chart time. All data comes from the Washington Post, 2015-2024.
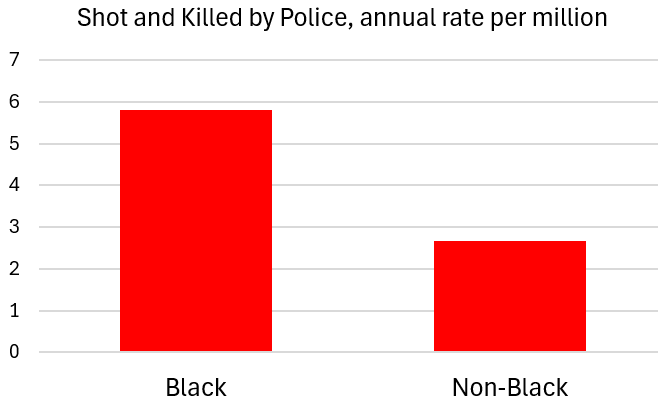
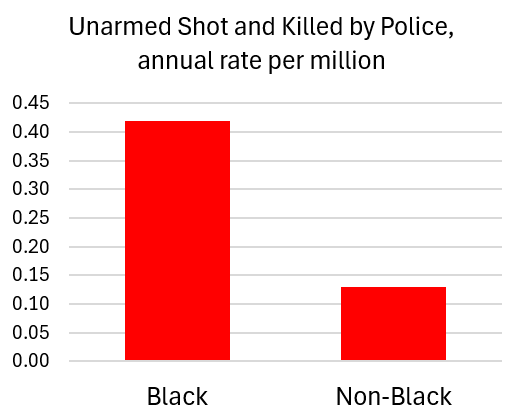
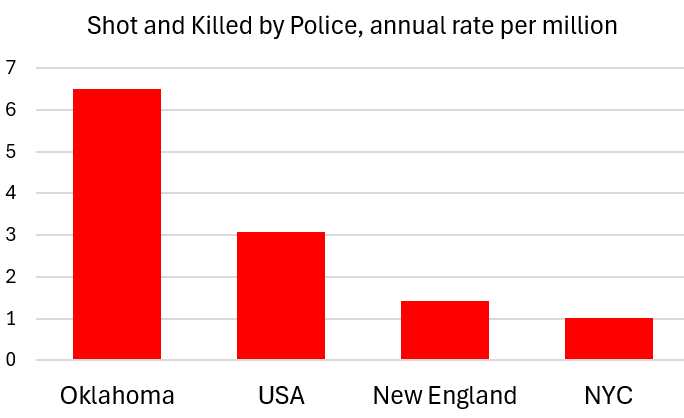
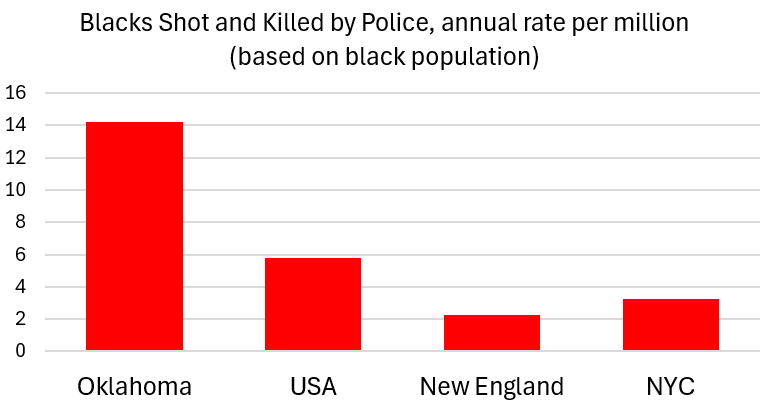
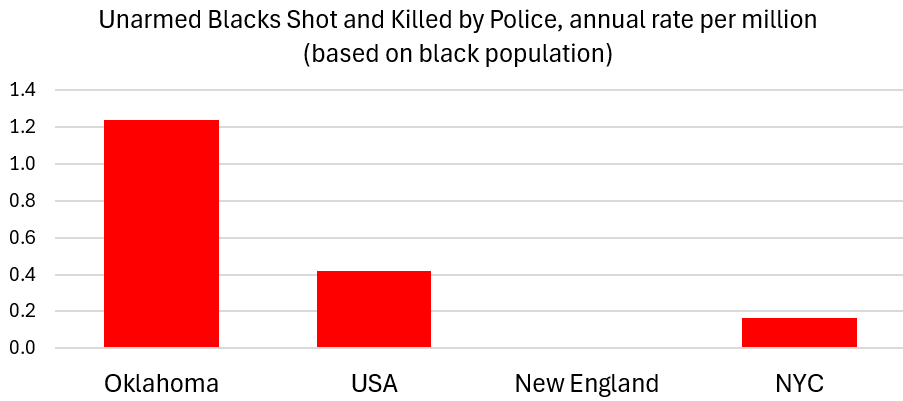
Make what you want of this. Ignoring circumstances (which matter greatly) the odds of being shot and killed by police is 2.2 times greater for blacks than for whites. If unarmed (again, ignoring circumstances), the odds are 3.2 times greater. And while the odds of being black, unarmed, and shot and killed by police in Oklahoma is slim, literally one in a million, those odds are still 7(!) times greater than in New York City and, well, infinitely higher than in New England.